Guides
JavaScript API
An embedded chart is not a picture. Your page can place order lines and brackets, drop buy/sell markers, draw shapes, add indicators and change the interval underneath them, and be told when the reader moves any of it.
Getting a chart
The loader gives you a controller for any placeholder it has mounted. Pass the element or a selector:
<div class="vp-chart" id="mine" data-symbol="BTCUSDT" data-datafeed="myfeed" data-height="480"></div>

<!-- No `async`: the loader defines `vpEmbed` when it executes, and the
     inline script below calls it. See the note under this block. -->
<script src="https://view.verticalprop.com/embed.js"></script>

<script>
  var chart = vpEmbed.chart('#mine');
  chart.setInterval('60');
</script>async from the loader tag whenever an inline script calls vpEmbed.** The loader assigns window.vpEmbed when it executes and there is no pre-load stub, so with async the inline script can run first, throw vpEmbed is not defined, and register nothing. The chart then sits on its loading state, which looks like an unavailable venue rather than an ordering problem. A markup-only snippet keeps async and is correct: it calls nothing, and the loader scans for .vp-chart when it arrives.Every method returns a promise, because every call crosses an origin boundary. You can ignore the return value, the call still happens, but a rejection is how the chart tells you an argument was wrong, so it is worth catching while you are building.
Chart state
| Method | Does |
|---|---|
setSymbol('AAPL') | Change instrument. Keeps drawings and indicators. |
setInterval('60') | Change resolution. Same vocabulary as data-interval. |
setChartType('area') | candles · bars · line · area |
setTheme('light') | light · dark. Drive it from your own theme switch. |
setStyle({ bg, up, … }) | Recolours the chart. The runtime equivalent of data-colors; see Styling. |
setVisibleRange({ from, to }) | Scroll and zoom to a window. Seconds. |
getSymbol() | Resolves to the current symbol. |
getInterval() | …the current resolution. |
getChartType() | …the current chart type. |
getVisibleRange() | …{ from, to } in seconds. |
Nothing appears until you ask for it, and it needs the toolbar: on a chrome-less embed the same call is refused, naming the attribute.
Order lines
An order line is a horizontal level with a label, a quantity badge and, if you let it, a drag handle and a cancel button. This is the primitive for “here is a working order”.
var line = await chart.createOrderLine({
  price: 64500,
  text: 'Buy limit',
  quantity: '1.5',
  lineColor: '#26a69a',
  editable: true,      // the reader may drag it
  cancellable: true    // …and dismiss it
});

// Later
line.setPrice(64200);
line.set({ text: 'Buy limit (moved)', lineColor: '#f7931a' });
line.remove();.setPrice(x).setText(y) would be a separate message across the boundary for each call, and the frame between them would show the new price beside the old label. set() takes everything at once and repaints once.Position lines and brackets
A position line carries entry, and optionally the whole bracket. Passing null to a leg removes it, which is how you cancel a stop without redrawing the position.
var pos = await chart.createPositionLine({
  price: 64000,
  text: 'Long 2 BTC',
  quantity: '2',
  takeProfit: 68000,
  stopLoss: 62500
});

pos.set({ stopLoss: 63000 });   // trail it up
pos.set({ takeProfit: null });  // cancel the target
Buy and sell markers
An execution marker is a fill, an entry, a signal at a point in time and price. Unlike a line it belongs to a bar rather than to a level.
await chart.createExecutionShape({
  time: 1767225600,      // SECONDS
  price: 64100,
  direction: 'buy',      // 'buy' | 'sell'
  text: 'Filled 1.5',
  arrowColor: '#26a69a'
});
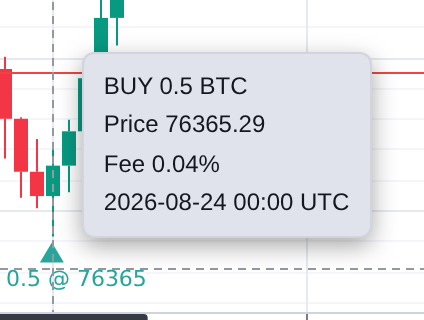
time here is in seconds, while a bar’s time in your datafeed is in milliseconds. That asymmetry is inherited from the contract this mirrors. It is called out beside every example rather than quietly normalised, because a host reading their own bars back would otherwise have two conventions and no way to tell which they are holding.A marker also carries a tooltip, which is where the detail that would not fit in text goes. It is a multi-line string, and it opens when a reader points at the arrow or its label.
await chart.createExecutionShape({
  time: 1767225600,
  price: 76365.29,
  direction: 'buy',
  text: 'Buy 0.5',
  tooltip: 'BUY 0.5 BTC\nPrice 76365.29\nFee 0.04%\n2026-08-24 00:00 UTC'
});
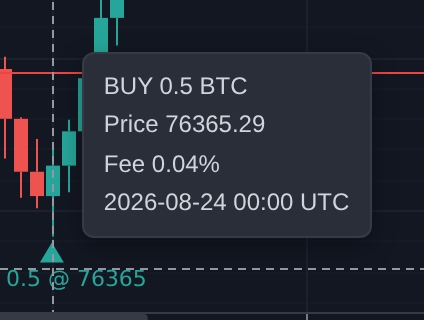
markerStyle picks the shape. The default arrow is a triangle at the price with the label beside it, which is right for one marker; badge puts the label INSIDE a roundel sitting against the price, which is what a HISTORY wants; a column of fills reads as B / S bubbles rather than as triangles each trailing a caption. The roundel's near edge is at the price, so the candle it marks stays visible beside it.
await chart.createExecutionShape({
  time: 1767225600,
  price: 76365.29,
  direction: 'buy',
  markerStyle: 'badge',
  text: 'B',                       // drawn INSIDE the roundel
  tooltip: 'BUY 0.5 BTC\nPrice 76365.29\n2026-08-24 00:00 UTC',
  arrowColor: '#26a69a',
  textColor: '#ffffff'             // read against arrowColor, not the chart
});text is drawn inside the roundel, so it wants a glyph or two; a longer label grows the roundel into a pill rather than being clipped, and the words belong in tooltip. And textColor is drawn ON arrowColor rather than on the chart, so the two have to contrast: set them from the same place in your code, or the letter ends up the colour of the disc it is inside. The markers demo switches a live pair between the two shapes.Drawings
Place a shape at a point, or across several. Both resolve to an entity id you can remove later.
var level = await chart.createShape(
  { time: 1767225600, price: 65000 },
  { shape: 'horizontal_line', text: 'Resistance', color: '#ef5350' }
);

var trend = await chart.createMultipointShape(
  [{ time: 1766620800, price: 61000 }, { time: 1767830400, price: 66000 }],
  { shape: 'trend_line' }
);

chart.removeEntity(level);
chart.removeAllShapes();| Points | Shapes |
|---|---|
| One | horizontal_line vertical_line text arrow_up arrow_down flag icon |
| Two or more | trend_line ray extended_line rectangle ellipse triangle fib_retracement parallel_channel horizontal_ray |
The lists are separate and a shape from the wrong one is refused rather than placed at a guessed second point. Options are text, color, backgroundColor, textColor and lock; the full style schema stays with the reader, in the chart’s own settings dialog.
Indicators
var ma = await chart.createStudy('Simple Moving Average', [20]);
var rsi = await chart.createStudy('RSI', [14]);

chart.removeEntity(ma);
chart.removeAllStudies();
Names resolve case-insensitively, and an id works too, 'Simple Moving Average', 'simple moving average' and 'sma' are the same study. A name that resolves to nothing rejects with the name in the message rather than resolving to a null id you would then pass to removeEntity.
These are the engine’s built-in studies. Community indicators are a different thing with a different trust story, see the indicators page.
A control of your own, in the chart’s toolbar
This is the one place your page's own UI can live INSIDE the frame. You name a label and are told when it was pressed; the frame draws it in the chart's own button style, beside the interval picker.
const watch = await chart.createToolbarButton({
  text: 'Watch',
  tooltip: 'Add BTC-USDT to your watchlist',
});

chart.on('toolbarButtonClick', async (e) => {
  if (e.handle !== watch.id) return;
  const on = await addToWatchlist(await chart.getSymbol());
  watch.set({ text: on ? 'Watching' : 'Watch', active: on });
});

// …and when your component unmounts
watch.remove();| Property | Type | Does |
|---|---|---|
text | string, ≤32 | The label. Short, because the cell sits in a fixed row beside the chart’s own controls and a long one displaces them. |
tooltip | string | Detail on hover. Never the button’s identity: title does not exist on a touchscreen, so anything a reader must know goes in text. |
active | boolean | The pressed state, for a button that is a TOGGLE. Setting it once is what makes the control announce itself as a switch, so leave it out on a plain action. |
icon | icon name | null | A glyph before the label, from a fixed list we draw ourselves: star, bookmark, bell, settings, plus, refresh, download, link, search, camera, expand, info. Never markup, a data URI or a URL: those would put your DOM, or a fetch you can watch, on our origin, which is the one thing the iframe exists to prevent. It never replaces text, which stays the accessible name. |
disabled | boolean | Present but not on offer: announced as disabled, skipped by the Tab key, and its presses are not reported. Use it where removing the button instead would make the header shuffle every time the symbol changes. |
data-toolbar="1".** With the header disabled there is nowhere to place a button, so the call is refused with a message naming the attribute rather than resolving to a handle for a control no reader can see. Up to 8, and a label of at most 32 characters. A toolbar cell sits in a fixed row, so a longer label pushes the chart's own controls off the end of it.You supply a STRING, never markup. That is the boundary doing its job rather than a limitation of the control: the whole reason the embed is an iframe is that your code does not execute on our origin, and an option that took HTML would hand back exactly what the frame exists to withhold. What you get instead is a button that already matches the chart it is in, on both themes, at every size, without a stylesheet.
active only if the button is a toggle.** A control that reports a pressed state is ANNOUNCED as a switch, so a plain action given active: false tells a reader using a screen reader that "Open in the app" is a switch they have not flipped. Leaving it out is not the same as false, and the button becomes a toggle the first time you set it.The press arrives as toolbarButtonClick carrying the handle's id, which is why the example compares it: a chart with three buttons reports all three presses through one event. Pointer and keyboard both fire it: the control is a real tab stop and answers Enter and Space, so it is not a button only a mouse can reach.
Run the whole thing
Every object above, on one chart, with the events printing underneath it. The series is generated inside the pen, so it needs no key and cannot be taken down by a venue; drag the blue line and watch orderMove arrive.
<script src="https://view.verticalprop.com/embed.js"></script>
<div class="vp-chart"
     data-symbol="DEMO"
     data-interval="60"
     data-toolbar="1"
     data-theme="dark"
     data-datafeed="myFeed"
     style="height: 420px"></div>
<pre id="log"></pre>

<style>
body { margin: 0; background: #0b0f19; color: #e6e8eb;
       font: 13px/1.5 ui-monospace, monospace; }
#log { padding: 8px 12px; margin: 0; white-space: pre-wrap; }
</style>

<script>
// A deterministic series, so the pen never depends on a venue and the
// same code always draws the same chart.
function bars(from, to, stepSec) {
  const out = [];
  let price = 100;
  for (let t = Math.ceil(from / stepSec) * stepSec; t <= to; t += stepSec) {
    price += Math.sin(t / 5000) * 0.6;
    const open = price;
    const close = price + Math.cos(t / 3000) * 0.8;
    out.push({
      time: t * 1000,                       // a bar's time is MILLISECONDS
      open, close,
      high: Math.max(open, close) + 0.5,
      low: Math.min(open, close) - 0.5,
      volume: 1000 + (t % 500),
    });
  }
  return out;
}

vpEmbed.datafeed('myFeed', {
  onReady: () => ({ supported_resolutions: ['60'] }),
  resolveSymbol: (name) => ({
    name, ticker: name, pricescale: 100, session: '24x7', timezone: 'Etc/UTC',
  }),
  // from and to are SECONDS; a bar's own time is MILLISECONDS.
  getBars: (symbol, resolution, from, to) => bars(from, to, 3600),
  subscribeBars: () => {},
  unsubscribeBars: () => {},
});

const log = (m) => { document.getElementById('log').textContent += m + '\n'; };
const chart = vpEmbed.chart(document.querySelector('.vp-chart'));

chart.on('dataLoaded', async () => {
  // Declare that this page can carry an order, or the price-scale menu
  // offers alerts and drawings only.
  await chart.setTrading({ quantity: 1 });

  const entry = await chart.createOrderLine({
    price: 101, text: 'Buy limit', quantity: '1', lineColor: '#26a69a',
  });

  await chart.createPositionLine({
    price: 99.5, text: 'Long', quantity: '2',
    takeProfit: 104, stopLoss: 97,
  });

  await chart.createExecutionShape({
    // SECONDS here, and it must be a bar's own opening time.
    time: Math.floor(Date.now() / 3600000) * 3600 - 3600 * 6,
    price: 99.5, direction: 'buy', text: 'Filled 2 @ 99.50',
    tooltip: 'Entry\n2 @ 99.50',
  });

  // One message, one repaint. There is no chaining.
  await entry.set({ price: 100.8, text: 'Buy limit (moved)' });
  log('objects placed. Drag the blue line.');
});

chart.on('orderMove', ({ handle, price }) => log('moved ' + handle + ' to ' + price));
chart.on('orderCancel', ({ handle }) => log('cancelled ' + handle));
chart.on('orderSubmit', (o) => log('submit ' + JSON.stringify(o)));
chart.on('positionClose', ({ handle }) => log('close ' + handle));
</script>
Drag the order line, press the cross on it, or use the price scale menu. Each gesture prints the event your page would receive.
Events
on(name, fn) returns an unsubscriber. Listen so your page stays in step with a chart the reader is also driving, the toolbar changes the same state your calls do.
var off = chart.on('intervalChanged', function (e) {
  console.log('now on', e.interval);
});

// The ones that make a line a control rather than a picture:
chart.on('orderMove',   function (e) { placeOrder(e.handle, e.price); });
chart.on('orderCancel', function (e) { cancelOrder(e.handle); });
chart.on('positionClose', function (e) { closePosition(e.handle); });

off(); // stop listening| Event | Payload | Fires when |
|---|---|---|
symbolChanged | { symbol } | You or the reader changed instrument. |
intervalChanged | { interval } | The resolution changed, from either side. |
chartTypeChanged | { type } | The chart type changed. |
dataLoaded | {} | A page of bars has been drawn. A good moment to place your lines. |
visibleRangeChanged | { from, to } | The reader panned or zoomed. Seconds. |
priceScaleChanged | { from, to, top, height, left, width, scale, inverted } | The price-to-pixel mapping moved: a new range, a resized iframe, or the reader switching to a log or inverted scale. Subscribe to keep your own overlay pinned to the chart. Fires once as soon as the chart has laid out, so a page can draw at mount rather than waiting for the reader to move something, and at most once per animation frame. |
orderSubmit | { side, type, price, quantity, symbol } | The reader picked Buy or Sell at a level. A request rather than a fill: the frame has no venue and no account, so your page decides. type is limit or stop, derived from which side of the market the level is on. Only ever fires after setTrading. |
orderMove | { handle, price } | An editable order line was dragged. Fires on RELEASE, never during the drag. |
orderModify | { handle, price } | An order line’s body was CLICKED rather than dragged, a press that never travelled. Distinct from orderMove on purpose: one says the reader put the level somewhere new, this says they want whatever ticket you keep for it. |
orderCancel | { handle } | The cancel button on a cancellable order line was pressed. |
positionClose | { handle } | A closeable position line was closed. |
positionModify | { handle, price } | A position line’s body was clicked. Open whatever ticket you keep for that position. |
positionReverse | { handle } | The reverse control was pressed. Only ever fires on a line you made reversible. |
positionMove | { handle, price } | An editable position line was dragged, on RELEASE. Absent on an ordinary position line, which does not drag at all. |
positionAddTakeProfit | { handle, price } | The reader pulled the TP handle off the pill and let go. price is where they RELEASED, not the position’s entry. A request, exactly like orderSubmit: nothing is drawn as a result, and the way you answer is to set takeProfit on the line and turn canAddTakeProfit off, which keeps what is on the chart equal to what your venue actually holds. |
positionAddStopLoss | { handle, price } | The same gesture on the stop handle. Answer it by setting stopLoss and clearing canAddStopLoss. |
toolbarButtonClick | { handle } | A toolbar button you added was pressed, by pointer or by keyboard. The whole of what such a button does: the frame draws a label and reports the press, and every consequence is yours. |
favoriteIntervalsChanged | { intervals } | The reader starred or unstarred a timeframe in the interval menu. intervals is the whole list, in menu order. The embed keeps nothing between page loads, so this is your cue to save it, by itself or through saveState. Restoring a list with loadState does not fire it. |
orderMove fires on release, not during the drag. There is deliberately no per-frame position event and no crosshair event: a stream of where somebody’s cursor is on a chart is behavioural data, and it is not ours to hand to a third-party page.Every property
The tables below are the complete set, checked against the validator on every build in both directions, so nothing here is missing, and nothing here has stopped existing. An unknown property is refused, so a stale row would break your chart rather than be ignored.
These thirteen are carried by both an order line and a position line.
| Property | Type | Does |
|---|---|---|
price | number | Where the line sits, in the instrument’s own units. |
text | string | The label in the line’s body. Up to 200 characters. |
tooltip | string | Shown on hover, so detail that would crowd the label has somewhere to go. |
quantity | string | The badge at the end of the line. A string rather than a number, because it is a label: “2.5 BTC” and “50%” are both things a host needs to put there. |
lineColor | colour | The line itself. Hex or rgb(); url() is refused. |
lineWidth | pixels, 1–100 | Thickness. Zero and negative are refused. |
lineStyle | 0–4 | 0 solid · 1 dotted · 2 dashed · 3 large-dashed · 4 sparse-dotted. Anything else is refused. |
bodyAlignment | "left" | "right" | Defaults to right. Anchors the whole label, quantity and button group to the chosen plot edge. Position TP/SL, breakeven and drag-preview labels follow. Independent of lineLength and extendLeft. Set on creation or update with { bodyAlignment: "left" } to keep recent candles clear on narrow charts. |
bodyPaddingLeft | pixels, 0–100 | Inset from the left plot edge when bodyAlignment is left. Defaults to zero. Moves all controls and protection labels together; does not shorten the line. Available on creation and update. |
bodyPaddingRight | pixels, 0–100 | Right-aligned inset; default 0. |
bodyPaddingHorizontal | pixels, 0–100 | Padding on each side of body and quantity; default 6. |
bodyPaddingVertical | pixels, 0–100 | Padding above and below the row text; default 3. |
bodyBorderWidth | pixels, 0–100 | Control outline width; zero hides outlines; default 1. |
bodyBorderRadius | pixels, 0–100 or null | Body radius override; null inherits borderRadius. |
quantityBorderRadius | pixels, 0–100 or null | Quantity radius override; null inherits borderRadius. |
buttonBorderRadius | pixels, 0–100 or null | Action and drag-out button radius; null inherits borderRadius. |
buttonWidth | pixels, 0–100 | Minimum action button width; default 18. |
buttonIconWidth | pixels, 0–100 | Action icon stroke width; default 1.5. |
extendLeft | boolean | Draws the line across the full width rather than from the current bar rightward. |
lineLength | percent, 1–100 | How far left the line reaches, as a share of the plot. Only consulted when extendLeft is off, since a line pinned to the left edge already spans everything there is. |
borderRadius | pixels, 0–100 | The corner radius of every box on the line: the label body, the quantity chip and each button. Individual bodyBorderRadius, quantityBorderRadius and buttonBorderRadius overrides may be set; null restores this shared value. 0 is square; anything past half the row’s height is a full pill, the embed accepts 0–100. |
bodyBorderColor | colour | Outline of the label body. |
bodyBackgroundColor | colour | Fill behind the label text. |
bodyTextColor | colour | The label text. |
bodyFont | CSS font, ≤120 chars | The label’s font, as a CSS shorthand: bold 12px "Inter", system-ui, sans-serif. url() is refused, for the reason a colour’s is, namely that the canvas would fetch from a page we do not control. |
quantityBorderColor | colour | Outline of the quantity badge. |
quantityBackgroundColor | colour | Fill behind the quantity badge. |
quantityTextColor | colour | The quantity text. |
quantityFont | CSS font, ≤120 chars | The quantity badge’s font. Same rules as bodyFont. |
createOrderLine adds three. The first two are what turn a drawn level into something the reader can act on.
| Property | Type | Does |
|---|---|---|
editable | boolean | Lets the reader DRAG the line, and fires orderMove where they dropped it. This is what makes an order line a control rather than a picture. |
cancellable | boolean | Shows the ✕ and fires orderCancel. Your side decides what that means. |
modifyTooltip | string | Hover text for the body, which fires orderModify when clicked rather than dragged. Says what the BUTTON does; the line’s own tooltip says what the level is. |
cancelTooltip | string | Hover text for the ✕. |
cancelButtonBorderColor | colour | Outline of the ✕ button. |
cancelButtonBackgroundColor | colour | Fill behind the ✕. |
cancelButtonIconColor | colour | The ✕ itself. |
createPositionLine adds five, two controls and the three legs of a bracket.
| Property | Type | Does |
|---|---|---|
closeable | boolean | Shows the close control and fires positionClose. On by default. |
reversible | boolean | Shows the reverse control and fires positionReverse. OFF by default, because turning it on is a promise to answer that event, and a control whose press goes nowhere is worse than one that is absent. |
closeTooltip | string | Hover text for the close control. |
reverseTooltip | string | Hover text for the reverse control. |
closeButtonBorderColor | colour | Outline of the close button. |
closeButtonBackgroundColor | colour | Fill behind the close button. |
closeButtonIconColor | colour | The close glyph. |
reverseButtonBorderColor | colour | Outline of the reverse button. |
reverseButtonBackgroundColor | colour | Fill behind the reverse button. |
reverseButtonIconColor | colour | The reverse glyph. |
takeProfit | number | null | The take-profit leg. null clears it, which is why it is nullable. |
stopLoss | number | null | The stop leg. null clears it. |
breakeven | number | null | The breakeven marker. null clears it. A whole bracket is one line and one set(), so a host cancelling a stop never has to tear the position down and redraw it. |
takeProfitColor | colour | null | The take-profit leg’s ink, and the ink of its drag-out handle and the level in flight, so one leg is one colour throughout. null restores the built-in green. |
stopLossColor | colour | null | The stop leg’s ink. null restores the built-in red. |
breakevenColor | colour | null | The breakeven marker’s ink. null restores the chart theme’s muted ink. |
canAddTakeProfit | boolean | Offers the drag-out TP handle: the small square a reader pulls off the pill to ask for a take-profit at the price they release on, reported as positionAddTakeProfit. OFF by default. Turn it off again once that leg exists, or the gesture invites a second take-profit on one position. |
canAddStopLoss | boolean | The same for the stop handle, reported as positionAddStopLoss. OFF by default. |
protectTooltip | string | Hover text for both drag-out handles. |
takeProfitLabel | string, ≤24 | What the leg is CALLED on the pill at the end of its level, the “TP” in TP 43,000. An empty string draws no pill, which is how you turn the label off. Not the same property as addTakeProfitLabel: this one is a name printed beside a price, that one is the text on a button. |
stopLossLabel | string, ≤24 | The same for the stop leg. Defaults to “SL”. |
breakevenLabel | string, ≤24 | The same for the breakeven marker, and EMPTY by default: it has always drawn an unlabelled dotted reference, so naming it is opt-in rather than something that appears on charts already using it. |
addTakeProfitLabel | string, ≤24 | The text on the drag-out TP handle. The handle measures its own label and grows to fit, so a longer one is legible rather than clipped. + TP is a common choice, since the gesture creates a leg rather than moving one. |
addStopLossLabel | string, ≤24 | The text on the drag-out SL handle. Defaults to “SL”. |
pnlPositiveColor | colour or null | Positive P&L ink; null follows the chart. |
pnlNegativeColor | colour or null | Negative P&L ink; null follows the chart. |
protectLabelFont | CSS font | Font for TP, SL, breakeven and draft labels. |
protectLabelPaddingHorizontal | pixels, 0–100 | Protection-label horizontal padding; default 5. |
protectLabelPaddingVertical | pixels, 0–100 | Protection-label vertical padding; default 2. |
protectLabelBorderRadius | pixels, 0–100 | Protection-label corner radius; default 0. |
protectLabelBorderWidth | pixels, 0–100 | Protection-label outline width; default 0. |
protectLabelBackgroundColor | colour or null | Protection-label fill; null follows the leg color. |
protectLabelBorderColor | colour or null | Protection-label outline; null follows the leg color. |
protectLabelTextColor | colour or null | Protection-label ink; null uses white. |
protectButtonBackgroundColor | colour or null | Drag-out button fill; null follows the close button. |
protectButtonBorderColor | colour or null | Drag-out button outline; null follows the leg color. |
protectButtonTextColor | colour or null | Drag-out button ink; null follows the leg color. |
protectFont | CSS font, ≤120 chars | The font on both drag-out handles. Same rules as bodyFont. |
protectLineWidth | pixels, 1–100 | How thick the take-profit, stop and breakeven levels are drawn. Independent of the entry’s lineWidth, which is why it exists: thickening the entry used to leave a hairline stop beside it. |
protectLineStyle | 0–4 | The dash pattern for the take-profit and stop levels, same vocabulary as lineStyle. Breakeven keeps its own dotted pattern, because it is a reference mark rather than a resting order and that difference is what the dash is carrying. |
protectFillOpacity | 0–1 | How strongly a drag-out shades the span it is proposing. While the reader drags a handle away from the pill, everything between the entry and the level under the pointer is washed in that leg’s own colour: red down to a stop, green up to a target, so the gesture says how much is being risked and not only where the level lands. It belongs to the GESTURE: the wash goes the instant the release books the order, because a resting stop is a level and not a region. Defaults to 0.16, the same strength as the depth wash in the price gutter, so the two read as one chart. 0 turns it off and changes nothing else. |
side | "long" | "short" | null | Which way the position points. Set it whenever you offer the drag-out handles: a long takes profit above its entry and stops below it, and unset the drag constrains NOTHING, so a reader can draw a take-profit into a loss and find out from your venue’s rejection. |
editable | boolean | Lets the reader DRAG the position line, firing positionMove. Off by default, and the default is the point: a position line stands for a fill, whose price is not the reader’s to move. Turn it on only where the line stands for a level that has not been placed. |
createExecutionShape has its own set: a marker belongs to a bar rather than to a level, so it takes a time and points a direction.
| Property | Type | Does |
|---|---|---|
time | seconds | When it happened. SECONDS since the epoch, not milliseconds. |
price | number | The level it happened at. |
direction | "buy" | "sell" | Which way the marker points, and which side of the price it sits on. Nothing else is accepted. |
markerStyle | "arrow" | "badge" | The SHAPE. arrow is the default; a triangle at the price with the label beside it. badge puts the label INSIDE a roundel sitting against the price, which is what a trade history wants: a column of fills reads as B / S bubbles rather than as triangles each trailing a caption. It changes what two other properties mean; see text and textColor. |
text | string | The label. Beside an arrow, so it can be a sentence; INSIDE a badge, where it wants a glyph or two; a longer one grows the roundel into a pill rather than being clipped. |
tooltip | string | Shown on hover. Where a badge’s words go, since its label is one glyph. |
arrowColor | colour | The arrow, or the badge’s fill. |
textColor | colour | The label. On an arrow it is drawn on the CHART; on a badge it is drawn on arrowColor, so those two have to contrast; set them from the same place, or the letter ends up the colour of the disc it is inside. |
font | CSS font, ≤120 chars | The label’s font. Same rules as a line’s bodyFont. |
arrowHeight | pixels, 1–100 | How tall the arrow is drawn, or the badge’s radius (7–14). |
arrowSpacing | pixels, 1–100 | The gap between the marker and the candle it marks; below the bar’s low for a buy, above its high for a sell. An arrow’s tip and a badge’s near EDGE both land there, so the bar is framed rather than covered. |
Every command
What the loader calls, and the wire name behind it. You need the second column only if you are driving the frame with postMessage yourself, the two that have no method of their own, updateLine and removeLine, are what a handle’s set() and remove() send.
| Method | Wire name | Does |
|---|---|---|
chart.setInterval(v) | setInterval | Change resolution. Same vocabulary as data-interval. |
chart.setChartType(v) | setChartType | candles · bars · line · area · footprint. The last draws order flow per price level and needs a feed that supplies it (levels on the bars, getFootprint, or subscribeTrades); without one it draws bars with no cells rather than a synthesised distribution. |
chart.setVisibleRange({from,to}) | setVisibleRange | Scroll and zoom to a window. Seconds. |
chart.setStyle({ bg, up, … }) | setStyle | Recolour the chart. The runtime half of data-colors, same ten role names. Merges, so a call names only what it is changing, and it outlives setTheme, because your palette is re-applied on top of each base theme rather than dropped. |
chart.createToolbarButton({ text }) | createToolbarButton | Put one of YOUR controls in the chart’s own header. Resolves to a handle; the press arrives as toolbarButtonClick. Needs data-toolbar="1", and says so rather than making a button nobody can see. |
button.set(props) | updateToolbarButton | Change a button’s label, tooltip or pressed state. |
button.remove() | removeToolbarButton | Take it back off. Removing one already gone is not an error. |
chart.saveState() | saveState | Hand the whole chart back as plain data: indicators, drawings, panes, the lot, plus the timeframes the reader starred under favoriteIntervals. Where you keep it is yours; we store nothing about your reader. Feed it to loadState to put it back. |
chart.loadState(state) | loadState | Restore what saveState gave you, starred timeframes included. It carries the symbol and interval it was saved on, so a page that owns those wants setDrawings instead. A state without favoriteIntervals leaves the reader’s stars alone. |
chart.getDrawings() | getDrawings | Just the annotations, as an array. The pair to reach for when your page decides the instrument and the reader decides what is drawn on it. |
chart.setDrawings(drawings) | setDrawings | Put them back. Replaces every drawing on the chart rather than adding to them, so restoring twice does not double them. |
chart.setTimezone(name) | setTimezone | The clock the time axis is read in. An IANA name such as Europe/Paris or UTC, never an offset, which cannot express daylight saving. The runtime half of data-timezone. |
chart.setNumberFormat('european') | setNumberFormat | How every number on the chart is punctuated: standard (1,234.56), european (1.234,56), plain (1234,56), spaced (1 234,56), or auto for the reader’s own locale. The runtime half of data-numberFormat. |
chart.setSessions([{ name, from, to, color }]) | setSessions | Tint trading sessions behind the bars. Each band is { name, from, to, color, days?, timezone? }: from / to are HH:mm read on the symbol’s own clock, or on timezone when the band names one; to <= from wraps midnight; days is 0 = Sunday to 6 = Saturday and defaults to weekdays; color carries its own alpha. Replaces the set, and an empty array clears it. The runtime half of data-sessions. |
chart.setScrollEnabled(false) | setScrollEnabled | Stop the reader panning off the window you chose. Hides no control, so the range chips still work if the toolbar is on. |
chart.setZoomEnabled(false) | setZoomEnabled | The same for zoom. Pair them to pin a chart to exactly one view. |
chart.getStudies() | getStudies | What is on the chart right now, as { id, name } each. The id is what removeEntity takes, which is how you remove one indicator rather than all of them. Accepted as getAllStudies too. |
chart.getAvailableStudies() | getAvailableStudies | What MAY be added, straight from the engine’s registry. Build your own indicator picker from it instead of hardcoding a list that drifts from whatever we ship. |
chart.exportData({ from, to }) | exportData | The bars behind the picture, as CSV. It narrows what is already loaded and never fetches, so on your own datafeed we never spend your rate limit on a call you did not make. null when the chart has no bars yet. |
chart.setMarks(marks) | setMarks | Put a round badge under a bar: the B / S pastille where a fill happened, with a tooltip on hover. Replaces the whole set, so send the list you want on screen rather than one mark at a time. time is epoch SECONDS and must be the bar’s OWN opening time: a mark is looked up by the bar it belongs to rather than placed at a pixel, so one that falls between bars draws nothing and says nothing. Take it from a bar you have rather than from a clock, and mind that a daily bar’s anchor is the venue’s, which is not always midnight UTC. |
chart.clearMarks() | clearMarks | Take them all off. Distinct from sending an empty array only in that it takes no argument; both leave the chart with no badges. |
chart.setTrading({ quantity, unitLabel }) | setTrading | Declare that this page can carry an order. Adds Buy / Sell rows to the price scale’s ⊕ menu, which emit orderSubmit. null withdraws them. Without it the menu offers alerts and drawings only, because the frame never assumes its host trades. |
chart.createOrderLine(props) | createOrderLine | A price level, optionally draggable and cancellable. |
chart.createPositionLine(props) | createPositionLine | An entry with its take-profit, stop and breakeven legs. |
chart.createExecutionShape(props) | createExecutionShape | A buy or sell marker at one bar. |
handle.set(props) | updateLine | Change any subset of a line’s properties. One message, one repaint. |
handle.remove() | removeLine | Take a line off the chart. Removing one already gone is not an error. |
chart.getShapes() | getShapes | Every drawing on the chart, as { id, name } each, where the name is the tool. The id is what removeEntity takes, so this is how you remove one drawing rather than all of them. Ids and tool names only; getDrawings is the one that hands back geometry. Accepted as getAllShapes too. |
chart.createShape(point, opts) | createShape | A single-point drawing: level, arrow, flag, note. |
chart.createMultipointShape(points, opts) | createMultipointShape | Two to eight points: trend line, zone, channel, retracement. |
chart.removeEntity(id) | removeEntity | Remove one drawing or one indicator by the id you were given. |
chart.removeAllShapes() | removeAllShapes | Clear every drawing YOU placed. |
chart.createStudy(name, inputs) | createStudy | Add an indicator. Up to 16 inputs. |
chart.removeAllStudies() | removeAllStudies | Clear the indicators you added. |
chart.getSymbol() | getSymbol | The instrument on screen. |
chart.getInterval() | getInterval | The current resolution. |
chart.getChartType() | getChartType | The current chart type. |
chart.getVisibleRange() | getVisibleRange | { from, to } in seconds. |
chart.getVisiblePriceRange() | getVisiblePriceRange | The price-to-pixel mapping, fetched once: the visible bounds, the plot band in the frame’s own pixels, and whether the scale is log or inverted. Resolves to null while the chart has not laid out. For a layer that FOLLOWS the chart, use the synchronous priceToY and subscribe to priceScaleChanged instead. |
When a call is refused
The promise rejects with a real Error naming the problem. Refusals are shape-level and specific, because the reader of the message is whoever wrote the call:
try {
  await line.set({ lineColour: '#fff' });   // British spelling
} catch (e) {
  console.error(e.message);   // unknown property "lineColour"
}
Unknown properties are refused rather than dropped, on purpose. A silently ignored property is a chart that never gets the colour you set, with no error anywhere, which is the failure this API has produced twice while every test around it passed.
The wire, if you are not using the loader
The loader is a convenience over postMessage. Everything above is one message type:
frame.contentWindow.postMessage({
  ns: 'vp-embed', v: 1, type: 'command',
  id: 'c1',                       // yours, echoed back
  method: 'createOrderLine',
  args: [{ price: 100, text: 'Buy' }]
}, '*');

// Back: { ns, v, type: 'commandResult', id: 'c1', value: 'order-1' }
//   or: { ns, v, type: 'commandError',  id: 'c1', reason: '…' }
//   or: { ns, v, type: 'event', name: 'orderMove', payload: { handle, price } }
Two older types remain for symbol and theme (setSymbol, setTheme), one door each, and those are the doors that were documented first.
Listening safely on your side
If you handle messages yourself rather than through the loader, check both the origin and the source. Origin alone is not enough when a page embeds more than one frame, without the source check, one frame can drive another.
window.addEventListener('message', function (ev) {
  if (ev.origin !== 'https://view.verticalprop.com') return;
  if (ev.source !== frame.contentWindow) return;   // the one people forget
  // …
});
Versioning
Every message carries v. A loader cached on your site for a year will still be talking to a server we have redeployed many times, and the version is how a newer embed recognises an older loader instead of misreading it. Messages whose version we do not understand are ignored, never guessed at.