VP Script
Visuals
Every way an indicator can put something on a chart. Each figure below was rendered by running the code beside it, so what you see is what that snippet does.
Plot styles
The five ways a series can be drawn: line, stepline, area, histogram and circles.
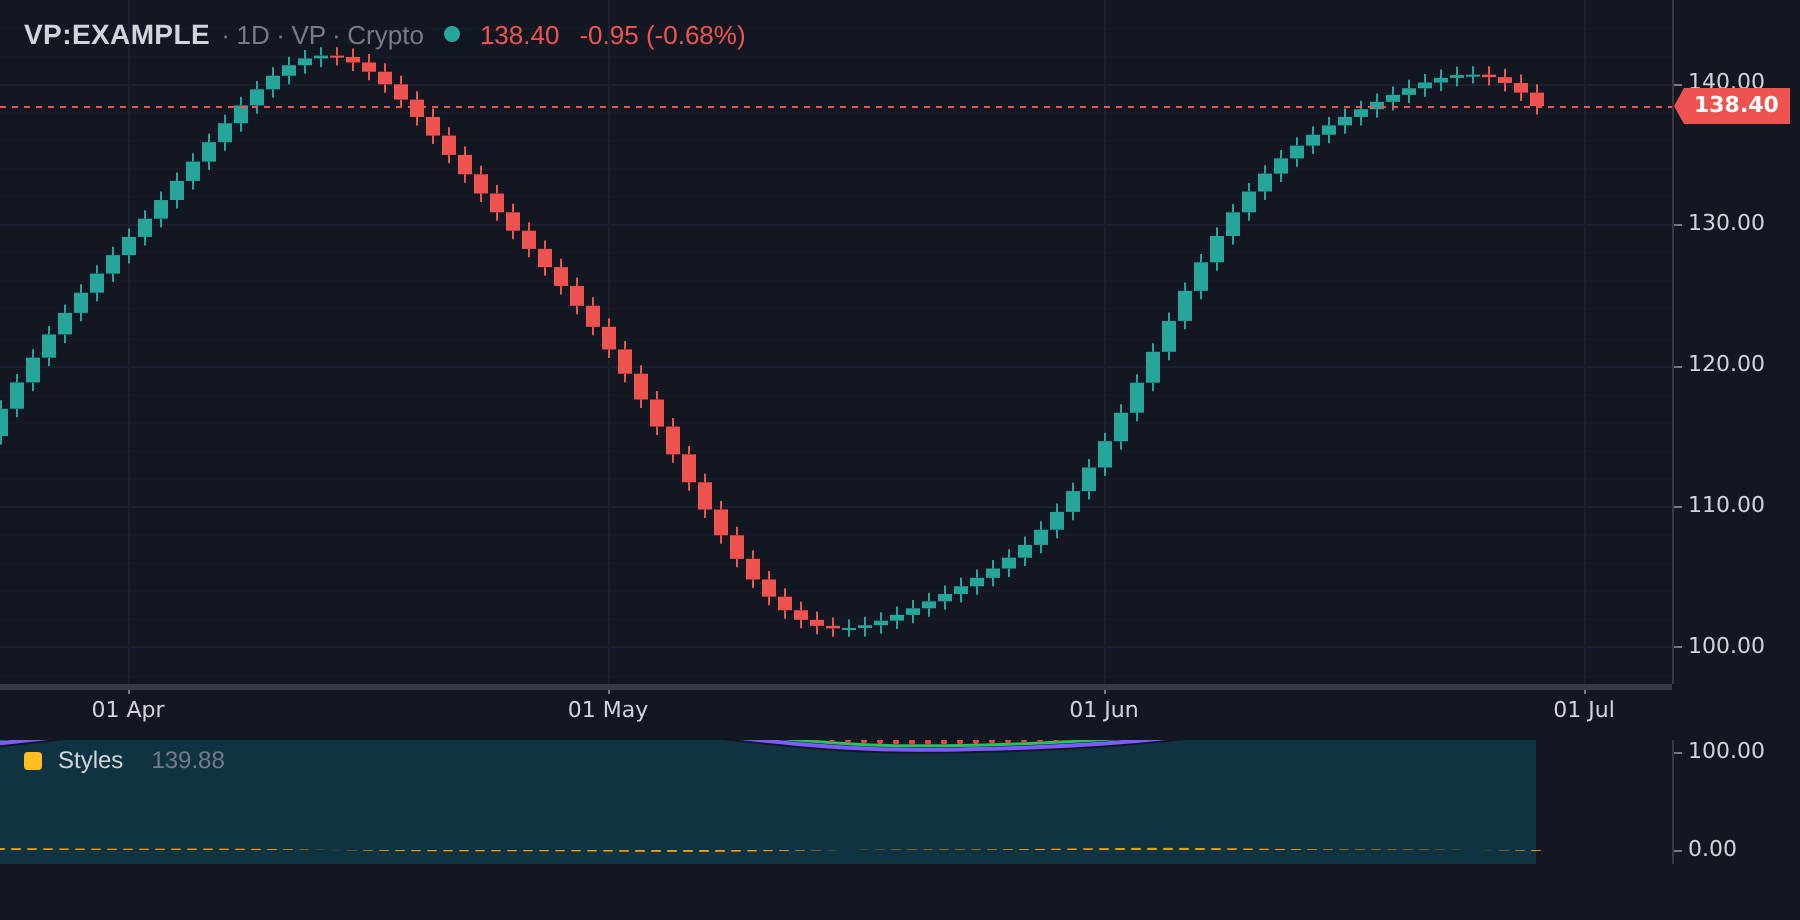
indicator('Styles', { pane: 'separate' }) const base = ta.sma(close, 10)plot(base, { title: 'line', color: '#7c5cff', width: 2 })plot(math.add(base, 4), { title: 'stepline', style: 'stepline', color: '#22c55e' })plot(math.sub(base, 4), { title: 'area', style: 'area', color: '#06b6d4' })plot(math.sub(ta.change(close), 0), { title: 'histogram', style: 'histogram', color: '#f59e0b' })plot(math.add(base, 8), { title: 'circles', style: 'circles', color: '#ef4444' })Bands and a fill
Two plots and the shaded band between them — fill takes the ids plot returns.
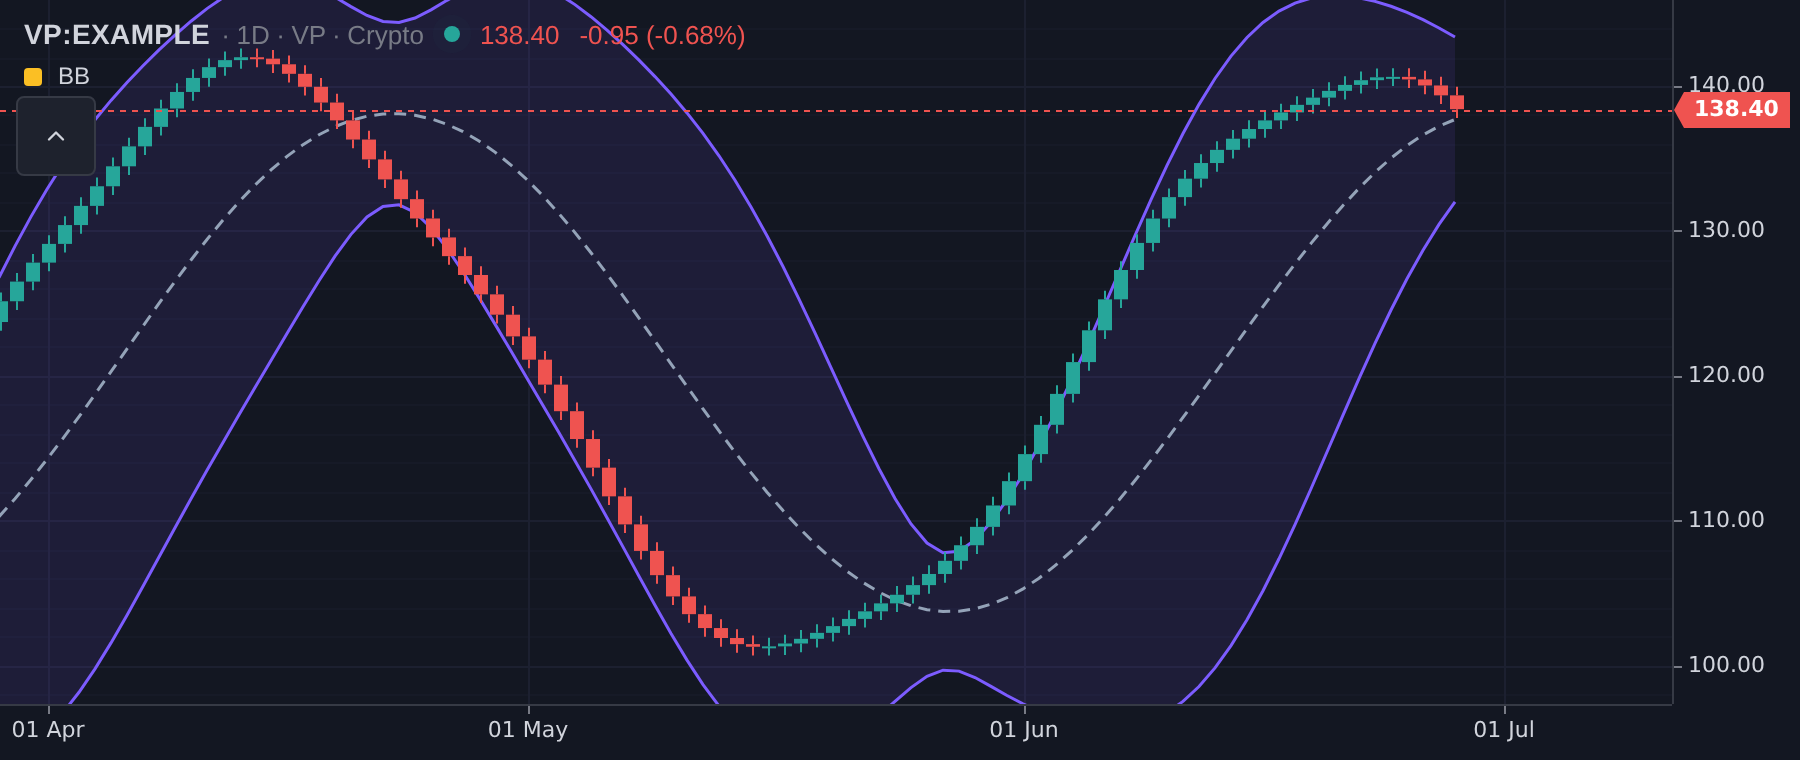
indicator('Bollinger', { shortTitle: 'BB' }) const bb = ta.bb(close, 20, 2)const upper = plot(bb.upper, { color: '#7c5cff' })const lower = plot(bb.lower, { color: '#7c5cff' })plot(bb.basis, { color: '#94a3b8', lineStyle: 'dashed' })fill(upper, lower, { color: 'rgba(124,92,255,0.10)' })Markers on a condition
marker takes a condition SERIES and draws wherever it is true — no loop needed.
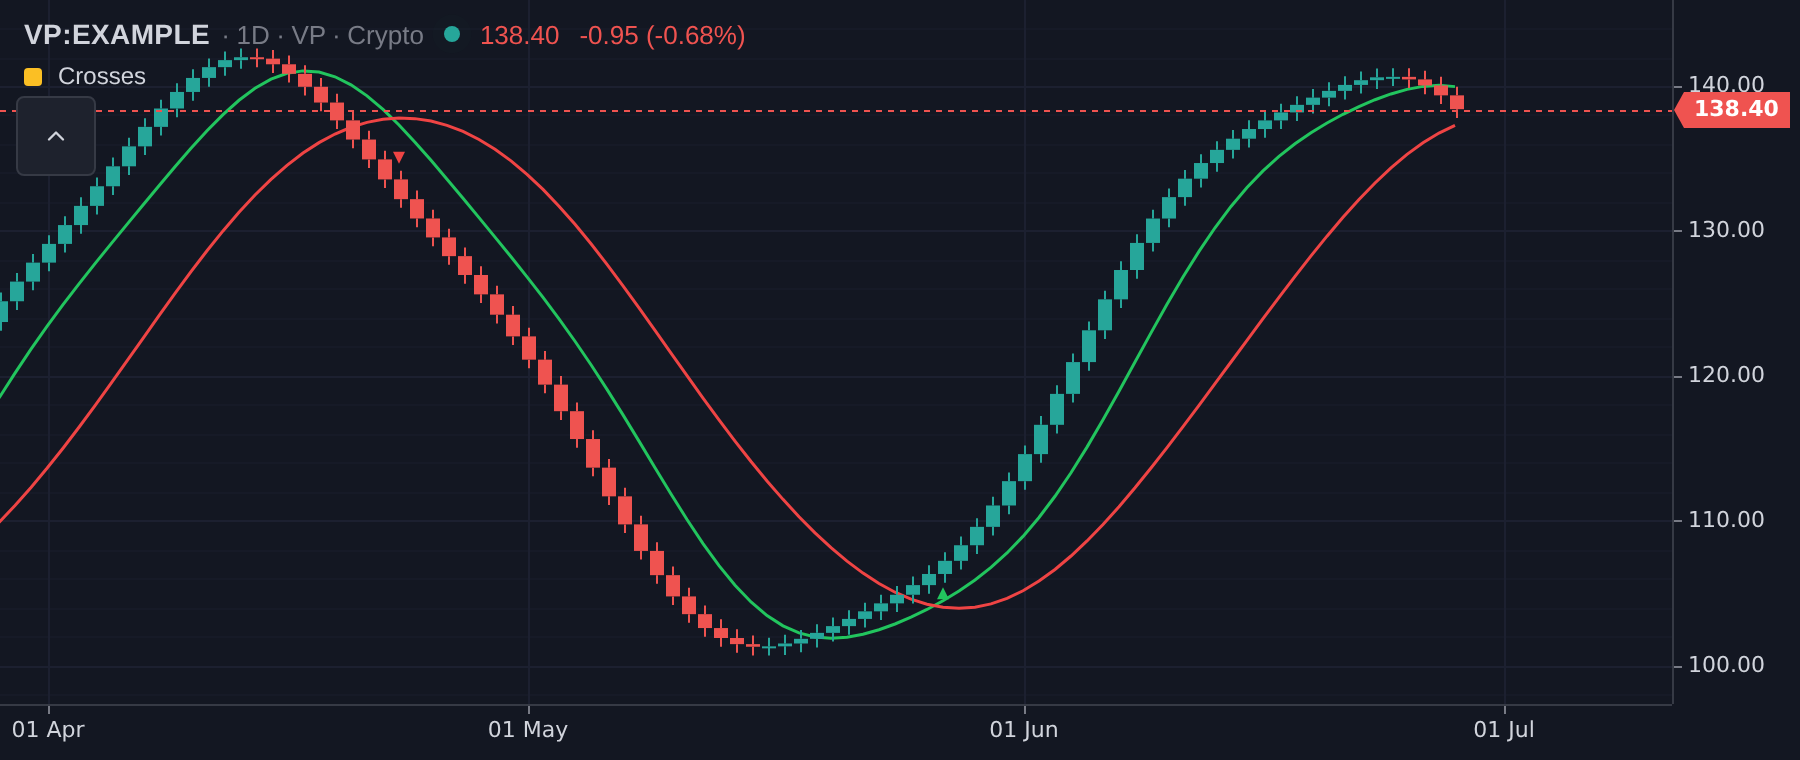
indicator('Crosses') const fast = ta.sma(close, 9)const slow = ta.sma(close, 21)plot(fast, { color: '#22c55e' })plot(slow, { color: '#ef4444' }) marker(ta.crossover(fast, slow), { shape: 'triangleUp', color: '#22c55e', location: 'below' })marker(ta.crossunder(fast, slow), { shape: 'triangleDown', color: '#ef4444', location: 'above' })One colour per bar
color accepts a series, so a line can change colour without becoming two plots.
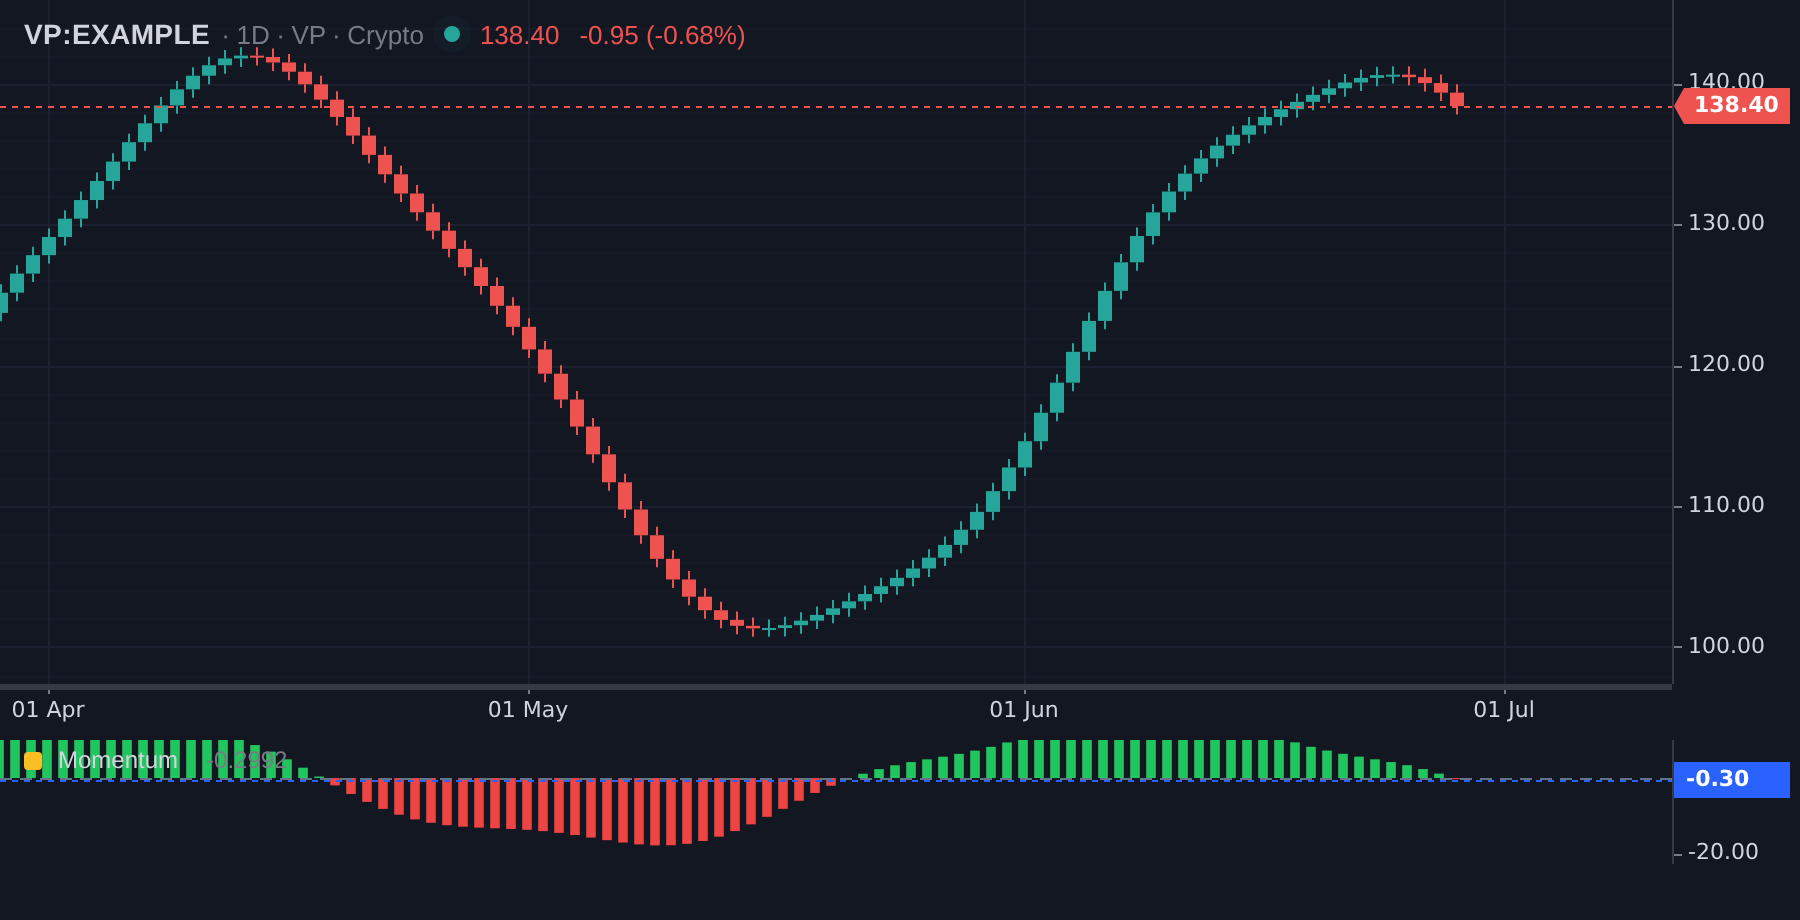
indicator('Momentum', { pane: 'separate' }) const mom = ta.mom(close, 10)const colors = mom.map((v) => (v === null ? null : v >= 0 ? '#22c55e' : '#ef4444'))plot(mom, { color: colors, style: 'histogram' })hline(0, { color: '#64748b' })A displaced, two-tone cloud
offset moves the drawing 26 bars forward into empty space; the values stay where they were computed.
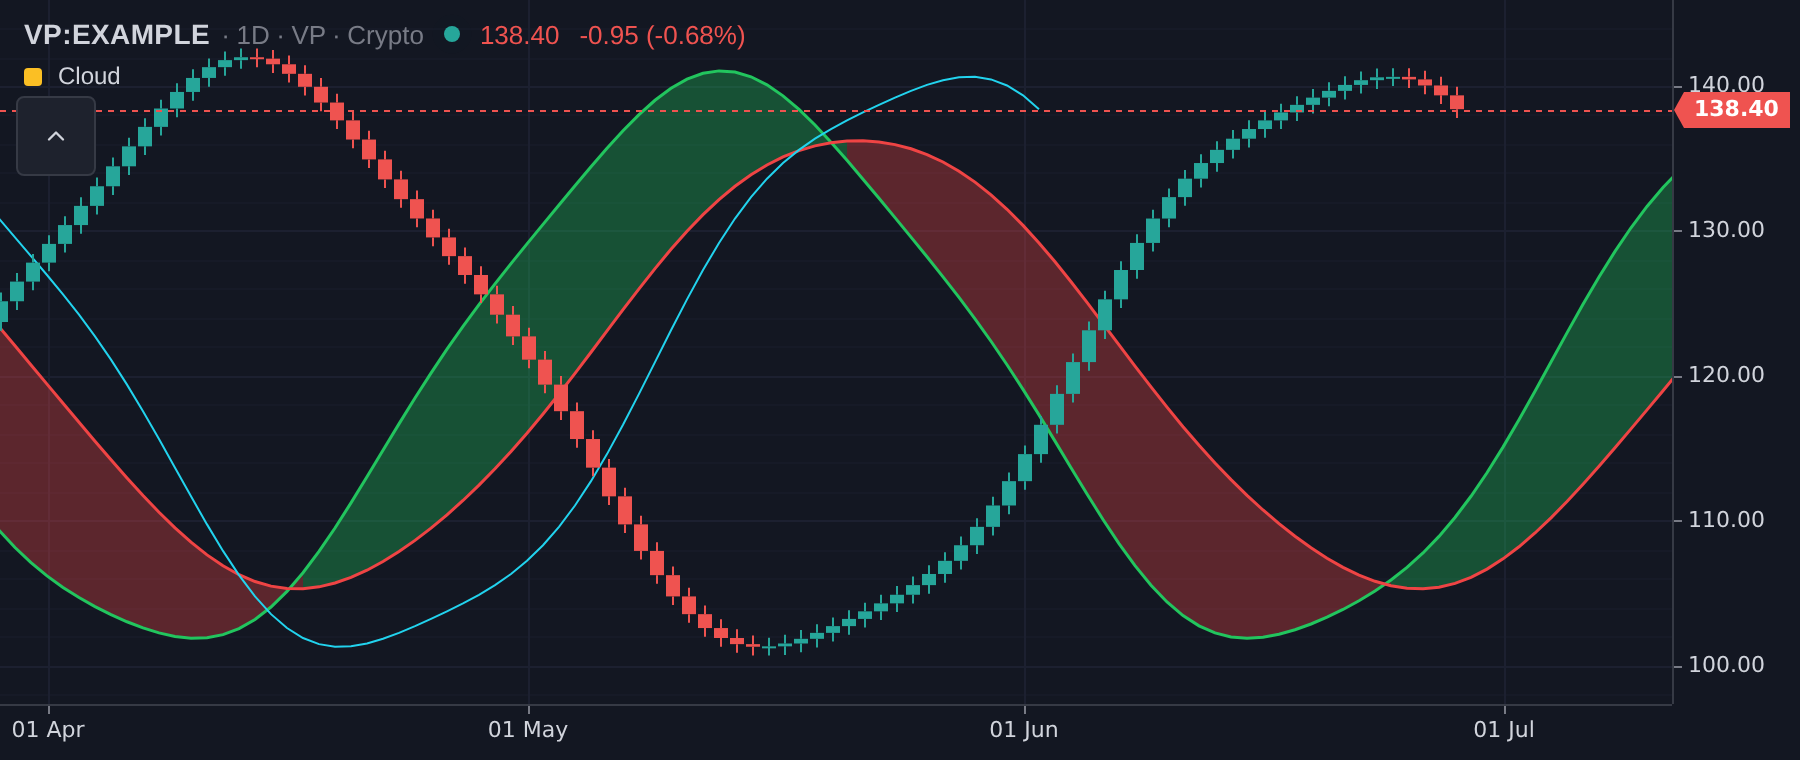
indicator('Cloud') const a = ta.sma(close, 9)const b = ta.sma(close, 26)const tone = a.map((v, i) => (v === null || b[i] === null ? null : v > b[i] ? '#22c55e55' : '#ef444455')) const pa = plot(a, { offset: 26, color: '#22c55e' })const pb = plot(b, { offset: 26, color: '#ef4444' })fill(pa, pb, { color: tone }) // Chikou: the close, drawn backward.plot(close, { offset: -26, color: '#22d3ee', width: 1 })Labels, lines and boxes
Placed at explicit points, for the few things that are not per-bar.
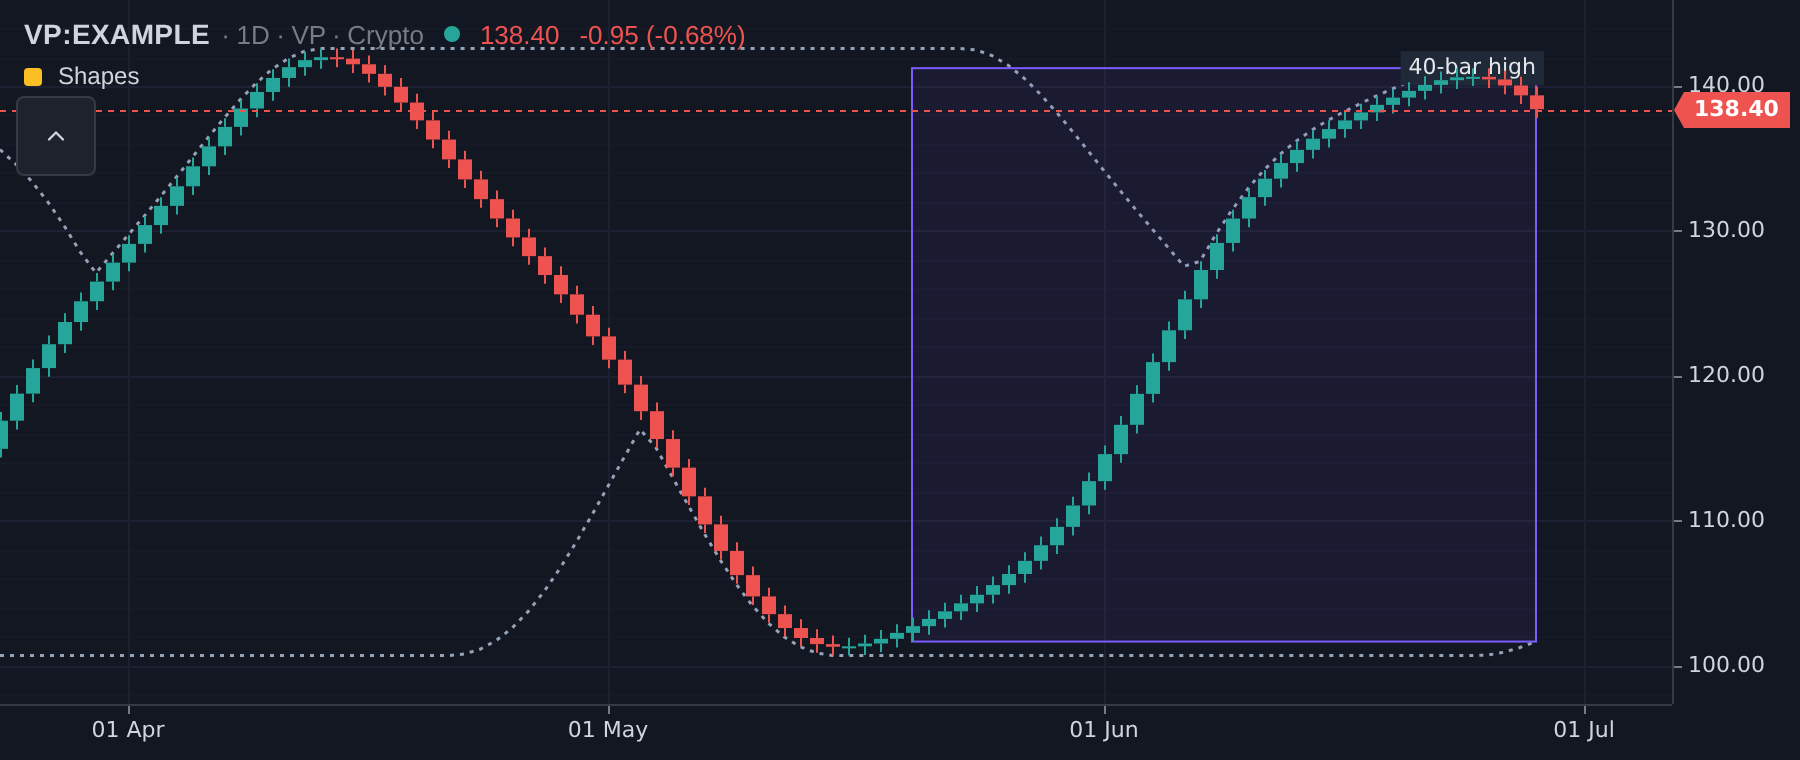
indicator('Shapes') const hi = ta.highest(high, 40)const lo = ta.lowest(low, 40) plot(hi, { color: '#94a3b8', lineStyle: 'dotted' })plot(lo, { color: '#94a3b8', lineStyle: 'dotted' }) box({ index: barCount - 40, price: lo[barCount - 1] ?? 0 }, { index: barCount - 1, price: hi[barCount - 1] ?? 0 }, { color: '#7c5cff', fillColor: 'rgba(124,92,255,0.07)' }) label(barCount - 1, hi[barCount - 1] ?? 0, '40-bar high', { background: '#1f2937', color: '#e5e7eb', align: 'right' })Tinting the background
bgcolor shades whole bars where a condition holds — regime, session, or a filter.
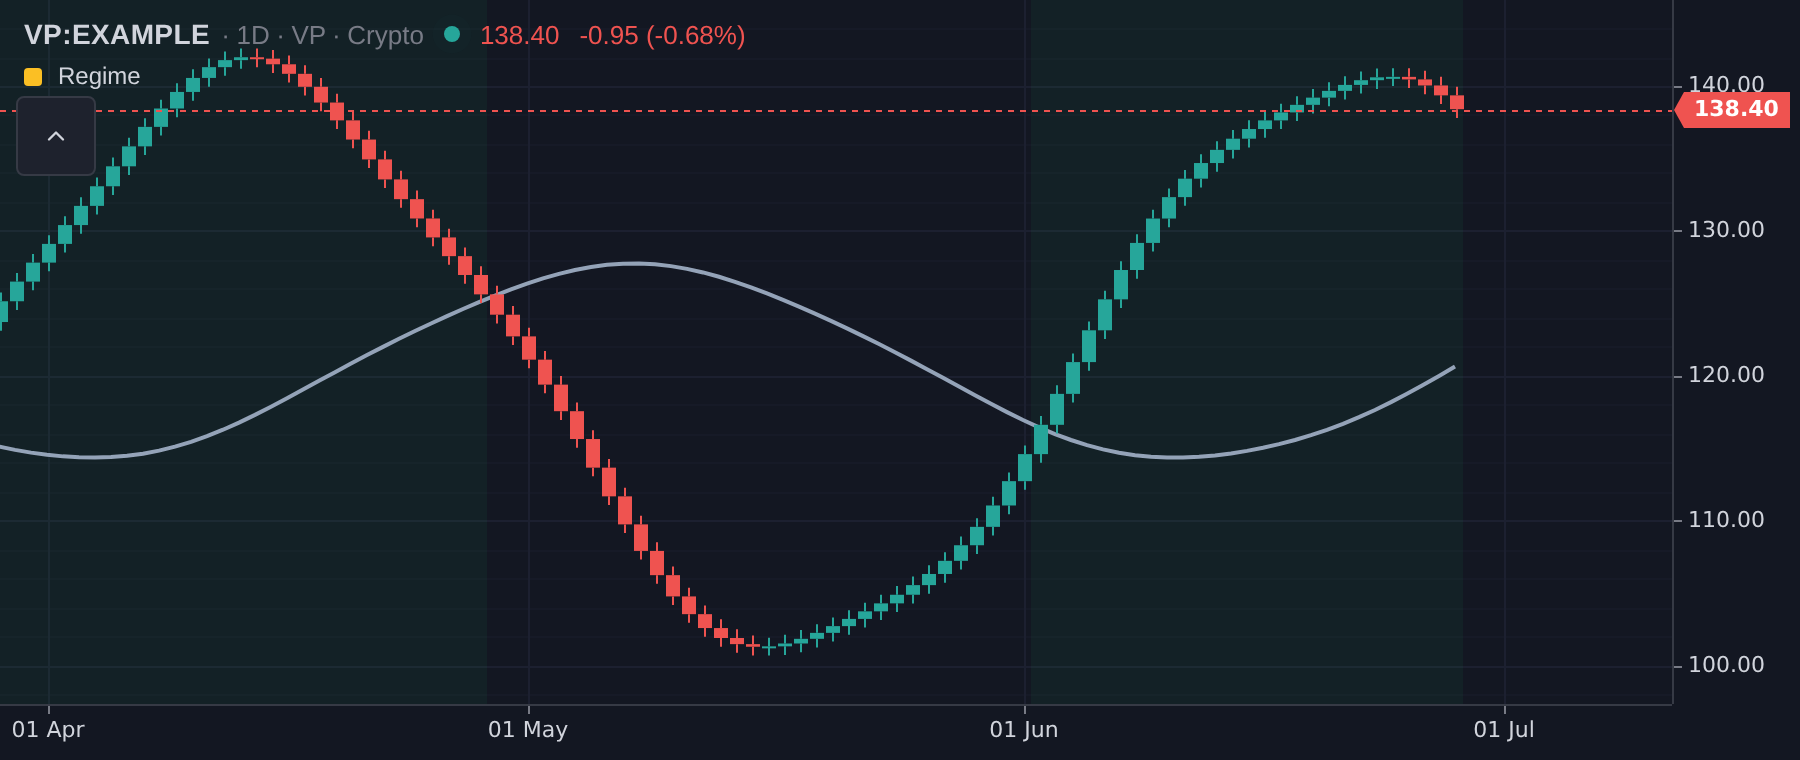
indicator('Regime') const trend = ta.sma(close, 50)plot(trend, { color: '#94a3b8', width: 2 }) const above = close.map((c, i) => (trend[i] === null ? 0 : c! > trend[i]! ? 1 : 0))bgcolor(above, { color: 'rgba(34,197,94,0.06)' })Your own candles
plotcandle draws an OHLC series you built — here a Heikin-Ashi transform.
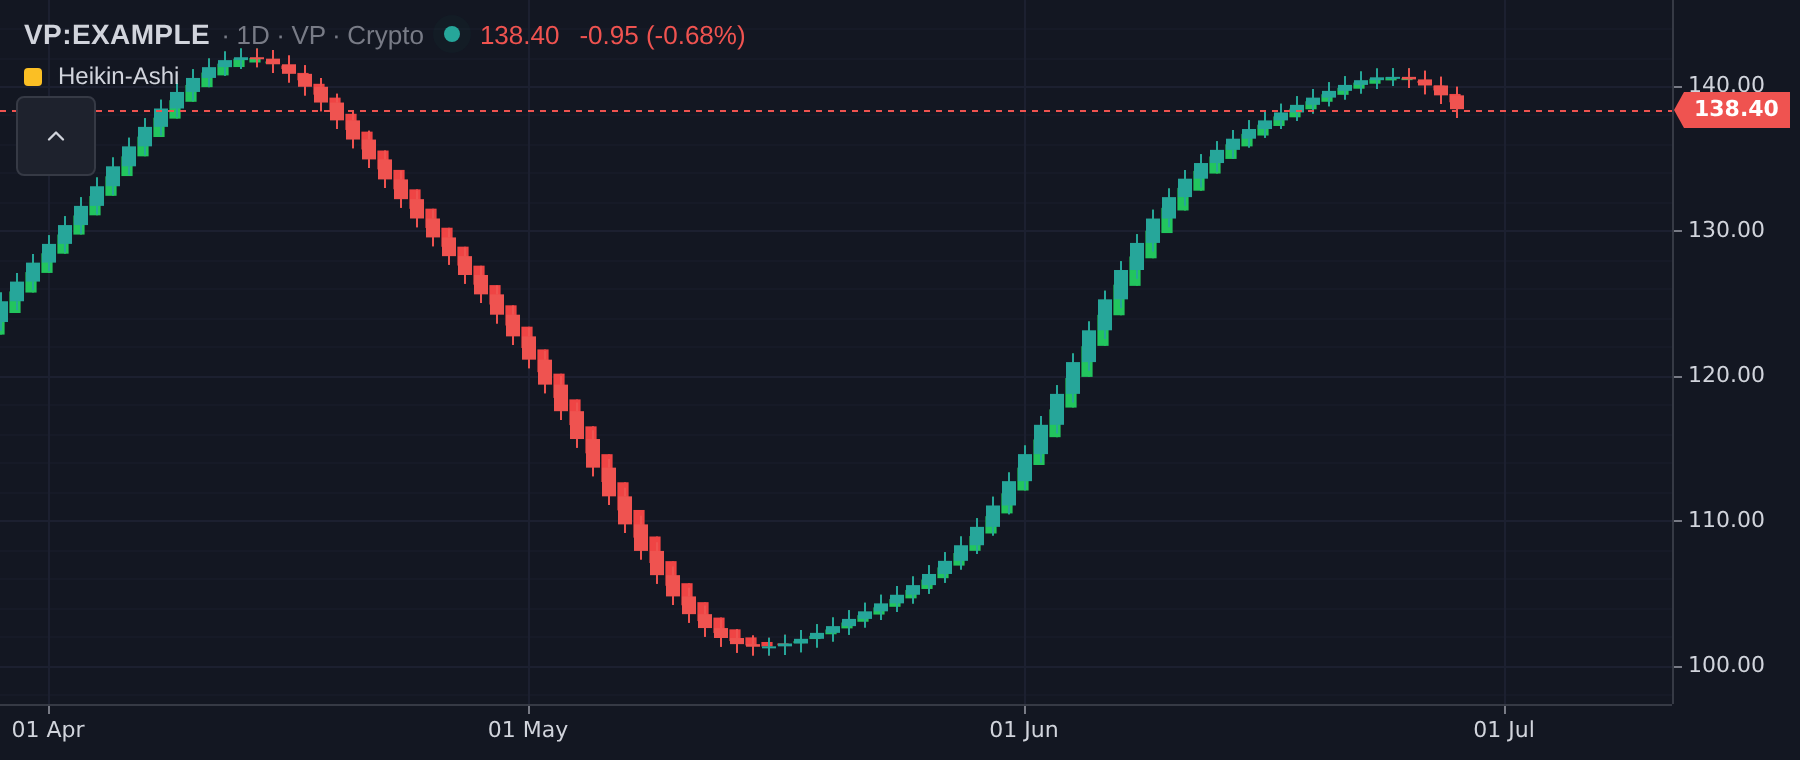
indicator('Heikin-Ashi') const haClose = ohlc4const haOpen: (number | null)[] = []for (let i = 0; i < barCount; i++) { const prev = haOpen[i - 1] haOpen[i] = prev == null ? (open[i]! + close[i]!) / 2 : (prev + haClose[i]!) / 2}const haHigh = high.map((h, i) => Math.max(h!, haOpen[i] ?? h!, haClose[i] ?? h!))const haLow = low.map((l, i) => Math.min(l!, haOpen[i] ?? l!, haClose[i] ?? l!)) plotcandle(haOpen, haHigh, haLow, haClose, { upColor: '#22c55e', downColor: '#ef4444' })